
insight on
your data.
to Web Analytics
Google Analytics is a very powerful tool for understanding your website’s user behavior. However, because of the richness and complexity of the data, just understanding the information can be a challenge, let alone finding opportunities and direction for improvement.
Dean realized this fact while growing Mad Mimi, and saw an opportunity to provide the same rich and powerful information, but in a simpler, actionable format that non-technical owners of websites could understand and utilize.
sense of
rich data.
The Process
For the initial Discovery process, I had several one-on-one meetings with the founder to define the goals and scope of the project. Given this was a new startup, we needed to breakdown the scope into multiple phases to make the project more manageable.
Once we had a clear understanding of the scope, we began diving into the user research the founder had collected over time. We defined user profiles around their technical web skill level, motivations & goals, and business types, which we later used as guidelines for the types of packaged reports available within the web application.
Once we had a clear understanding of the user types, we moved on to developing the user scenarios that would define the application functionality, within scope. We defined system characters (ie. “Account Management System”, “Notification System”) the user would interact with, as well as defined the primary scenarios in each use case.
Based on the diversity of users that utilize services like Google Analytics, we learned through the Discovery process the types of questions and how data should answer those questions varied greatly.
To create an application that was manageable and simplified the interface and experience of Google Analytics, we had to make some generalizations about the common types of questions website owners have and defined pre-packaged reports around them.
For example, some of the questions we had were:
Simple: Am I getting traffic?
Medium: Is my traffic increasing/decreasing?
Advanced: How can I control bounce-rate (stop-loss)?
With the use-cases defined, I then created visual schematics for the primary task-flows in the application, ie. creating a new account, purchasing a report, creating a goal, etc. Once we had consensus on the application flows, I moved on to creating wireframe schematics of the web application.
For an application of this complexity, I followed an object-oriented design pattern and designed components that would build up the user interface in layers. This allowed for UI components to be reused across the different areas of the application and established a common language for the interface.
Given the application’s user interface primary function was to visualize data, we also spent a considerable amount of focus on defining how to visualize that data. We worked with a data scientist to help analyze sample data sets from website analytics and based on our defined reports, determine the appropriate visualizations that would present the data correctly and allow for deeper exploration.
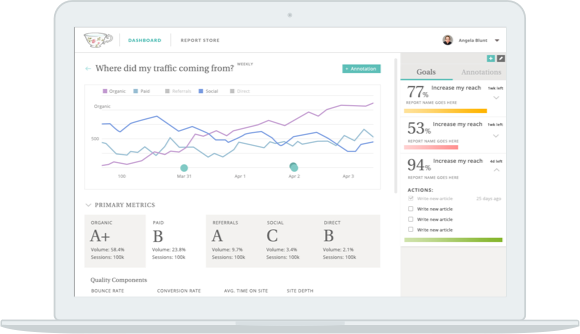
The final solution was a simple analytics tool that allows website owners to choose a type of report they want to view, create a goal, define actions to accomplish their goal, and track their performance.
While not directly involved in the implementation for this project, the technology stack utilized HTML5 technologies on the client-side and a decoupled architecture with Ruby on Rails in the backend.
- Client: Teacup Analytics
- Agency: Ikayzo, Inc.
- Engagement: September 2014 — May 2015
-
Technology
- Frontend: AngularJS
- Backend: Ruby on Rails
- UX Design: Mike King
- UI Design: Arlyn Ramos
- Branding, Art Direction: Arlyn Ramos
- Illustration: Arlyn Ramos
- Frontend Development: Scott Yano
- Backend Development: Leo DeCandia